 Facebook
 Twitter
 Pinterest
 Copy Link
Hi All,
If you’ve found this page, you’re in luck. It means that you are good at research and are likely to make a well educated home purchasing decision.
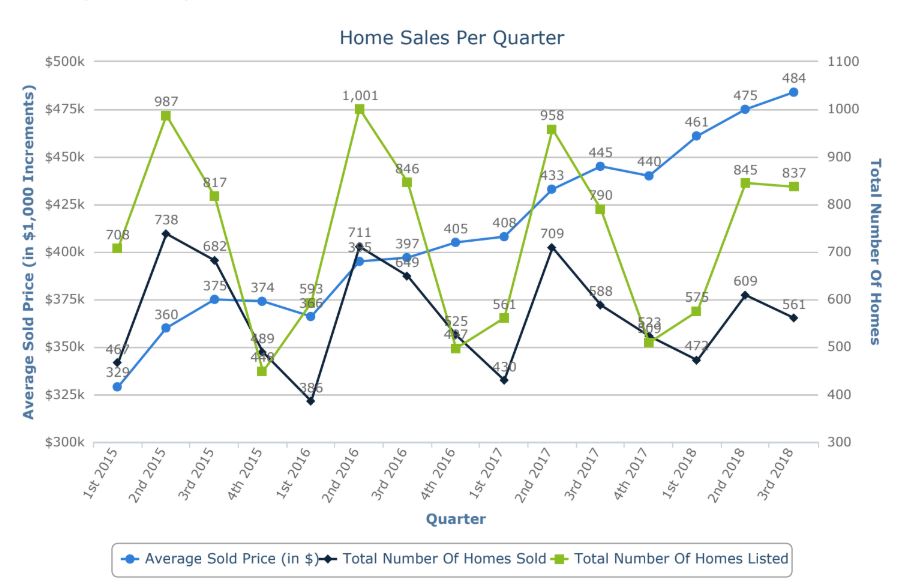
In this blog, I’m just trying to pump out some information on 2018 YTD. Below is a chart of Home Sales by quarter for Salt Lake City. I pulled data back through 2015 so you can see the breakdown of the otherwise very obvious trend lines. Interestingly, prices continue to climb while number of listings and the commensurate number of sales both declined significantly in Q2 2018 (on a historical q/q perspective).
Q2 ’18 listings were down 13.8% vs 3yr average
Q2 ’18 Houses Sold was down 14.2% vs 3yr average

It appears as though some cyclical structure was broken in Q2. I am unsure why this happened – I can only guess that prices continue to rise, and would-be sellers are worried about selling and then buying another property in a rising interest rate world – preferring to remodel than move. This could account for the decline in listings but strong pricing pressure because, frankly, there isn’t much inventory.
Inventory remains low, though it is creeping up slightly – currently at 3.76mo worth of homes at current absorption rates, up from 3.17mo just 6 months ago. It may not seem like much, but that is a 18.6% increase!

What does it all mean? I can surmise, but your analysis is as good as mine. I will say, the old adage hold firm: “Don’t wait to buy real estate, buy real estate and wait.”
Let me know I’f you want more data, to chat about RE, or if you want to buy/sell a property!
Thanks!
Carlo Ciriello
